 Have you ever wondered about some of the demographic and political differences between Ocean Beach and Point Loma – two neighboring communities that make up most of the Peninsula?
If you have, then the Community Almanac published in last Sunday’s San Diego Union-Tribune has many answers for you. Hidden deep inside the Sunday bundle was the almanac of San Diego’s communities in a 153-page magazine. 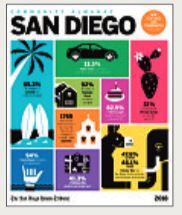 Laden with ads, the mag does shine with maps, good demographics and other data of the County’s numerous neighborhoods, from north county to east and south county and points in between.
Besides the demographic charts and data, there are short sections, such as “How it got its name”, “Local points of interest”, “What to do”, and so on. And of course, both Ocean Beach (pg 81) and Point Loma (pg 83) are listed.
Spoiler Alert: the OB Rag and yours truly got a great shout-out in the section, “Did you know?” on the OB page.
Right off the bat, of course, are the major differences: Point Loma has 3 and a half times the population OB has – not surprising as Point Loma has a much larger land mass.
 OB’s median home price of $753,000 is a little more than three-quarters the median home price in Point Loma – which is closing in on one million. And a little more than a fifth of Ocean Beach residents own their own home (21.4%) – which also means a little less than four out of 5 OBceans rent. Over half (52%) of Point Lomans own theirs.
In terms of household incomes, no surprises there either as Point Loma has always had the upper hand financially. One fifth of OB households earn less than $30,000 annually, whereas 2 out of every 5 Point Loma households make $100,000 or more every year. OB is more of a working and middle class neighborhood.
Reflecting that and the fact OB is geographically more “isolated” than Point Loma, only about a quarter of OBceans have a commute of less than 15 minutes, whereas 31% of Point Lomans do.
OB is a younger neighborhood, with nearly 53% of residents under the age of 35 and only 7.5% over 64. Point Loma has less than half of its residents under 35 and over 14% are 65 or older. And not even 30% of OB residents are “married now” – contrasted with Point Loma’s more than 46%.
Both OB and PL are mostly white ethnically, but Point Loma is slightly more diverse with a non-white ethnic make-up of 27.4% compared to OB’s 21.9%.
Here’s something OB can be proud about: students have a higher rate of meeting or exceeding state standards in both English and math than Point Loma students. (Math scores: OB 69% vs PL 51%.) Both communities have the same number (54%) of residents with college or higher degrees.
Finally, another no head-shaker: OBceans are more liberal than Point Lomans in voting trends. 69.5% of OB voters went for the Democrats in 2016, 58.2% of Point Loma voters did. A little over one-fifth of OB voters went Republican whereas nearly 35% Point Lomans did. A whopping 9% of OB went for third party candidates.
Here’s a side-by-side chart we put together based on the Community Almanac data. (NOTE: the first Age category is supposed to be “35”, not “25”. )


{ 1 comment… read it below or add one }
Wow I’ve always wondered about this! Thanks for writing this!